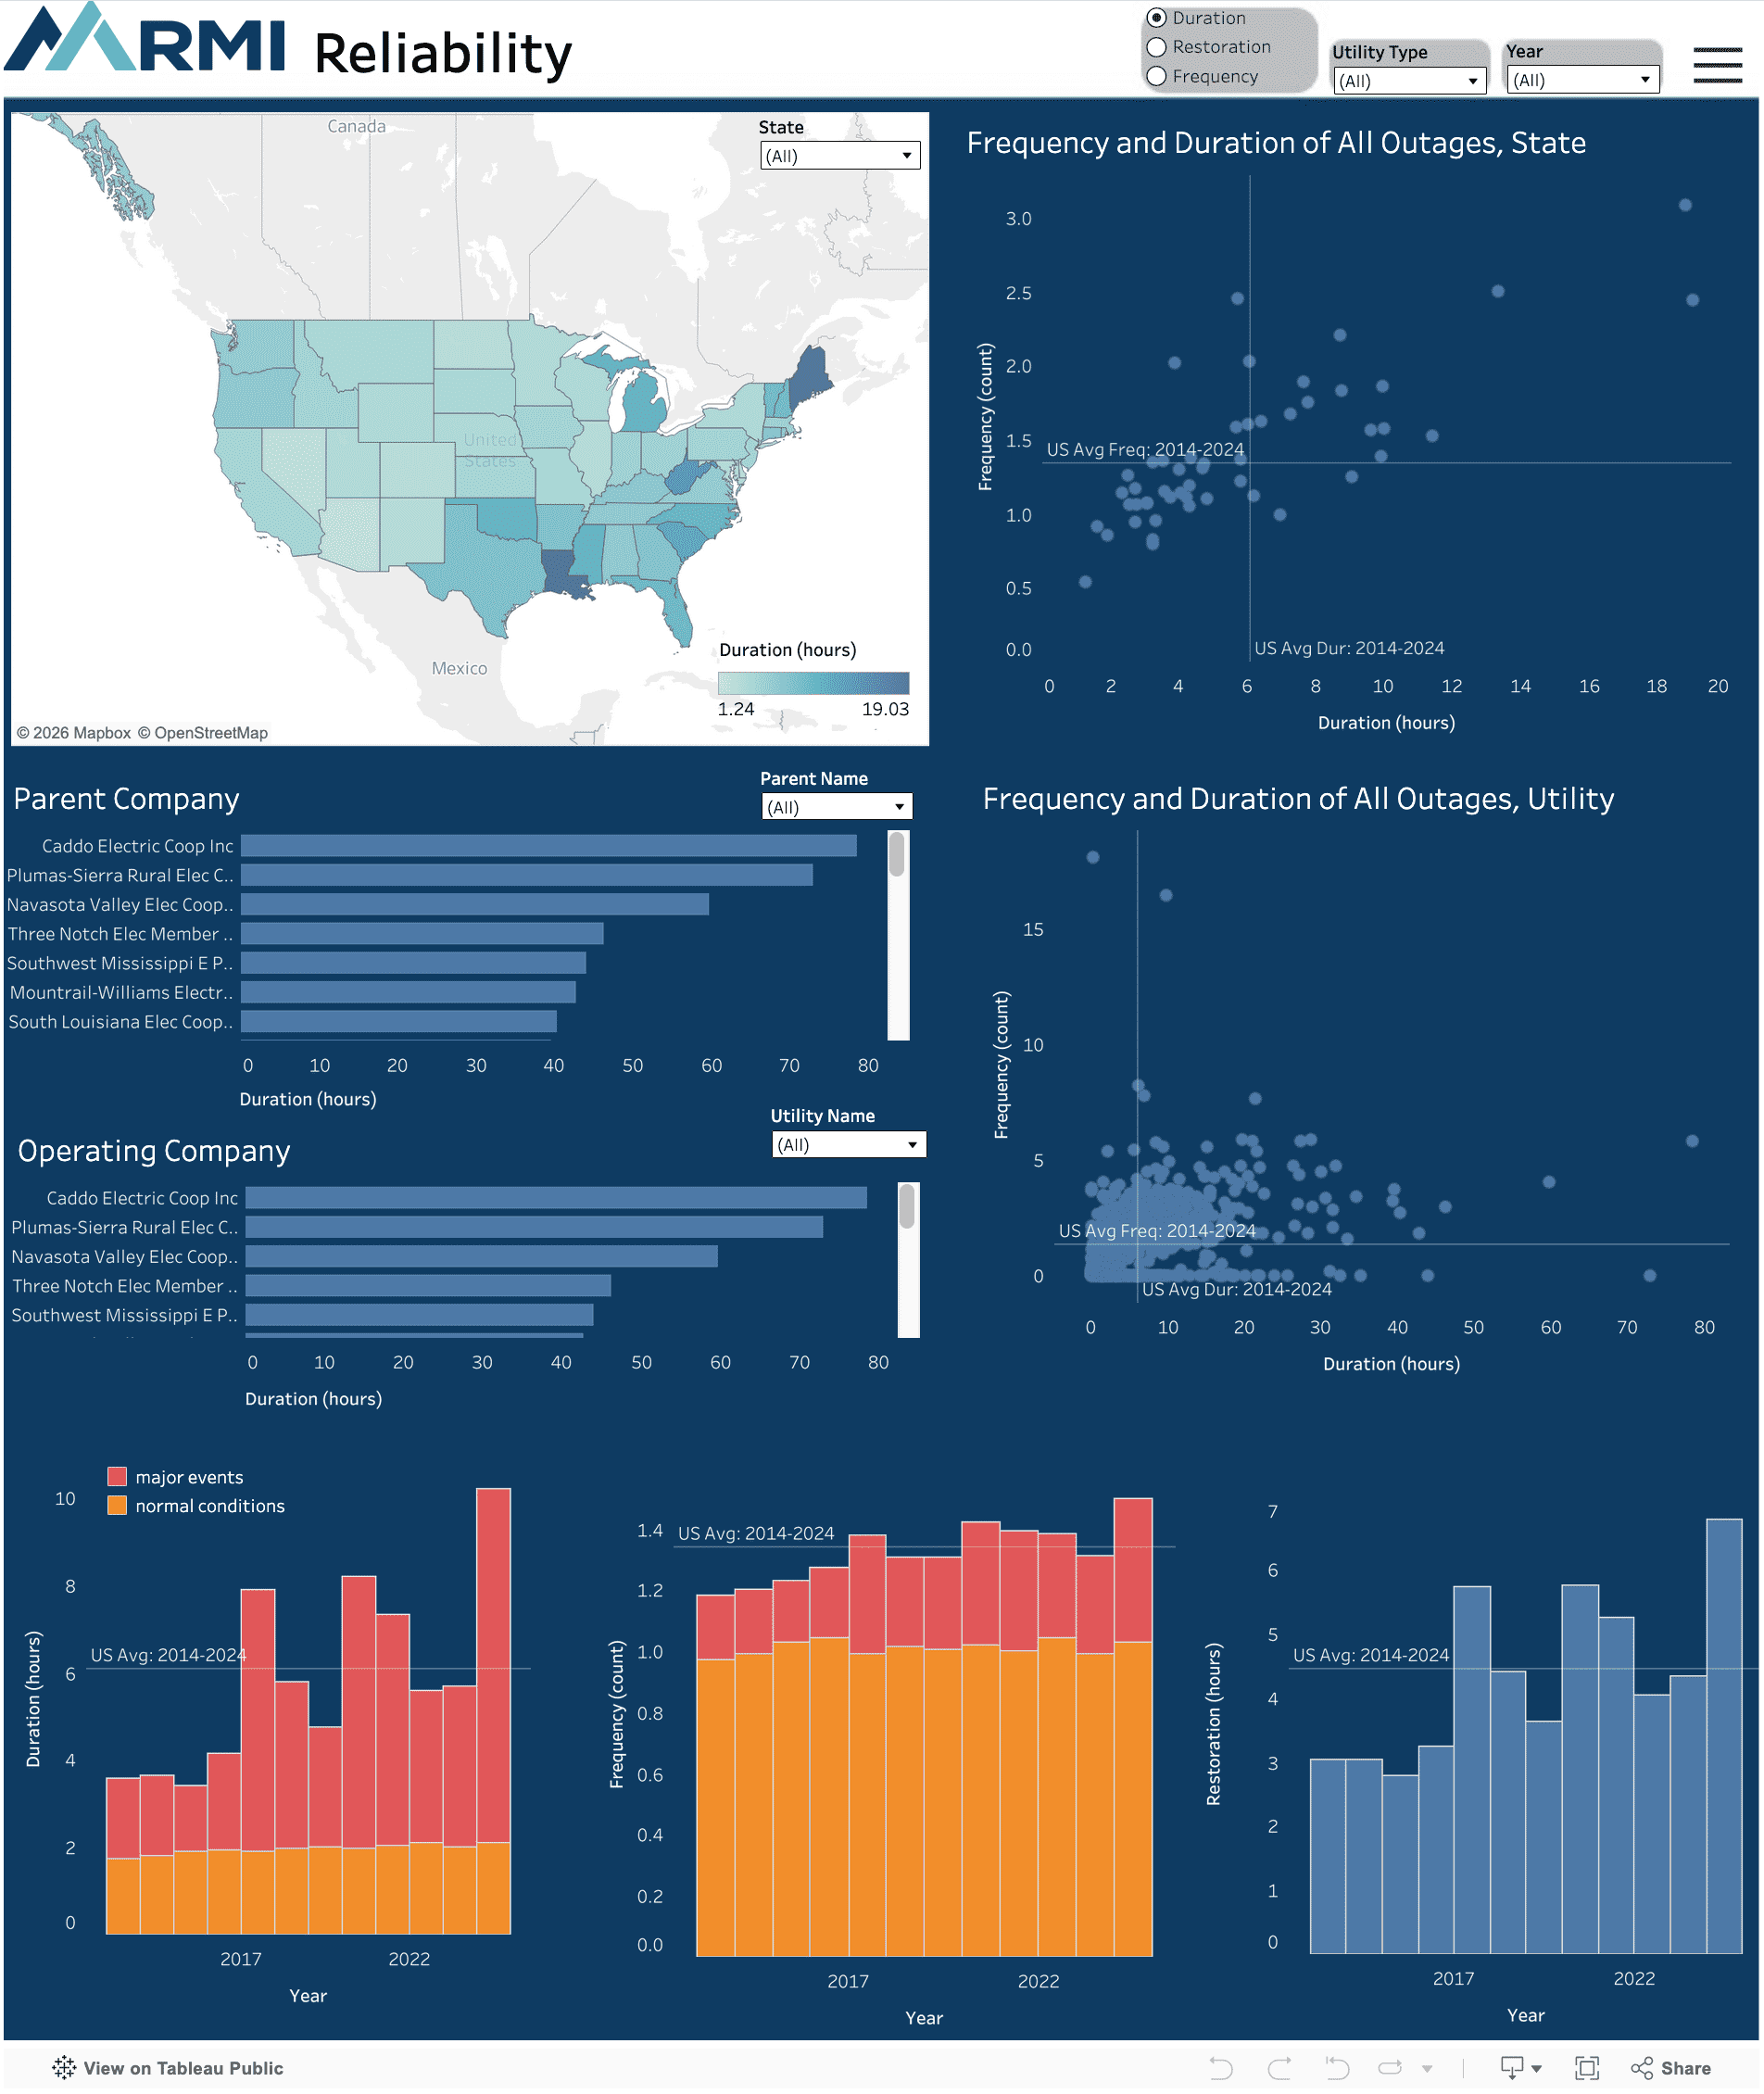
Select Metric, Utility Type, and Year(s)
All data shown are customer-weighted averages of nonmomentary power outages, which are defined as those lasting longer than 5 minutes.
Metrics
Duration: The sum of the length (hours) of nonmomentary electric outages experienced over the course of the year by the average customer. Also known as System Average Interruption Duration Index (SAIDI).
Frequency: The sum of the number (count) of nonmomentary electric outages experienced over the course of the year by the average customer. Also known as System Average Interruption Frequency Index (SAIFI).
Restoration: The average time (hours per outage) it took electric providers to restore power to customers after nonmomentary electric outages over the course of the year. Also known as Customer Average Interruption Duration Index (CAIDI).
Utility Type
Utility types are based on definitions from RMI’s Utility Transition Hub.
The Hub categorizes utilities based on ownership structure from EIA Form 861, with additional sub-categories within EIA’s category of “Investor Owned.” Definitions of these utility types are as follows:
Cooperative (C): Member-owned organizations.
Federal (F): Government agencies with the authority to deliver energy to end-use customers.
Investor-Owned Utilities (I): Entities that are privately owned and provide a public service.
Vertically Integrated: Entities that are privately owned, operate in a rate-regulated structure, and own most or all power supply assets along with transmission and distribution assets to supply service to customers.
Restructured: Entities that are privately owned, operate in a rate-regulated structure, and have moved from Vertically Integrated by selling/disposing of most power generation assets. They continue to own and operate some generation assets while operating transmission and distribution systems that serve customers.
Transmission (T): Entities that operate or own high-voltage transmission wires that provide bulk power services, but own no significant distribution or power generation systems.
Municipal (M): Entities that are organized under authority of state statute to provide a public service to residents of that area.
Political Subdivision (P) (also called "public utility district"): Independent of city or county government and voted into existence by a majority of the residents of any given area for the specific purpose of providing utility service to the voters. State laws provide for the formation of such districts.
Retail Power Marketer (R) or Energy Service Provider: Entities that market power to customers in restructured markets.
State (S): Entities that own or operate facilities or provide a public service.
Transmission (T): Entities that operate or own high voltage transmission wires that provide bulk power services but own no significant distribution or power generation systems.
Filter by State and/or Utility
Filter data displayed on the dashboard by clicking on a state on the map or a utility name in the bar charts (multiple selections allowed), or by using the dropdown filters. To clear your selection, click in the empty space within the same chart.
Additional Information
The map and state aggregation are based on utility ownership. Average outage data aggregated to more than one operating company (to parent company or state) is weighted based on the number of operating company customers.
Utilities will either report their reliability data conforming to IEEE standards or to other non-standardized methods. This dashboard includes reliability data that conforms to any methodology tracking outage duration, frequency, and restoration, including but not limited to the IEEE reporting standards.
Outage data is separated by outages caused by “Major Events” and outages caused by “Normal Conditions.” Major Events include outage events often caused by extreme weather, while Normal Conditions include outage events often caused by vegetation, wildlife, or other localized outage drivers.
For more information about how metrics are defined, see the informational video from EIA.
Updates to this dashboard will occur once each year when annually reported reliability data is released by EIA.
For more information about grid reliability data and example analyses based on this data, see our April 2026 article Reliability Explored: What a Decade of Data Tells Us About US Grid Reliability.
Data Sources